Image Classification
The Problem
This exercise introduced the capabilities of ArcGIS to classify and analyze image files. The emphasis is on learning how to reconfigure the image color bands, use the Image Classification toolbar to reclassify and analyze image layers for the specified Land Cover Classes, and exporting a GRID file.
The project mission is to develop a professional GIS analysis of the land cover data for the managers of the Black Water National Refuge for the production of a land management plan. Their focus is on six main land cover classes: Forest, Cultivated Field, Barren Area, Developed/Impervious, Wetland, and Water.
Strategies
This GIS analysis was done using ArcGIS 10.2.2 ArcCatalog and ArcMap with the specific focus on the use of Image Analysis for Supervised Classification and Spatial Statistics Tools. The data was provided through the State of Maryland GIS database, and was provided by downloading the "image_y1326" zip file. The data to be used is a raster tif file which provides the image color bands for the required land cover class info. The data file has the associated table necessary for analysis.
Methods
Part One:
1. Save a blank ArcMAP map file to "My_Name".mxd.
2. Add the Raster image tif file to the Data Frame.
3. Determine the correct data files and layers, features, and attributes to use for analysis. The NLCD 2001 Land Cover Class Definitions will be used as reference documentation.
4. The First Analysis Step will be to modify the color bands to change the appearance of the image from true-color to color-infrared. Red: Band 4, Green: Band 3, and Blue: Band 2.
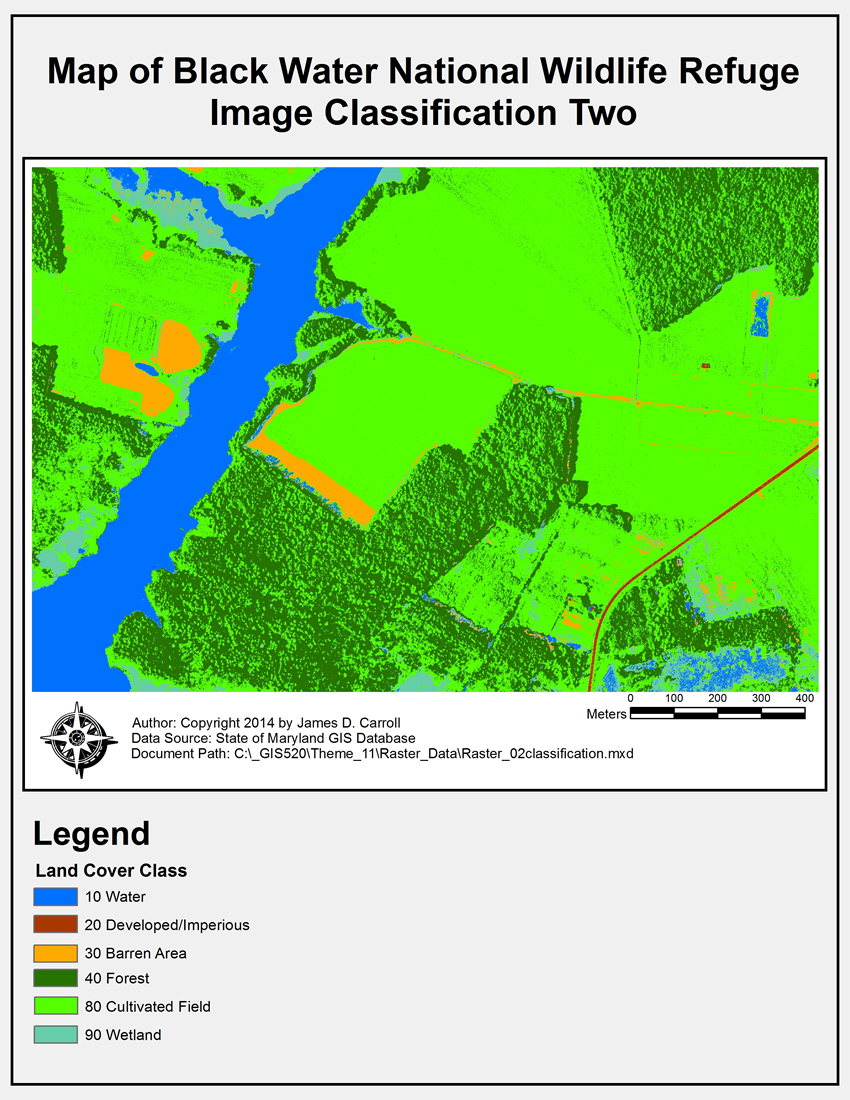
5. The Second Analysis Step will be to perform a Supervised Classification with the Image Analysis Toolbar using at least two training sample polygons per Land Cover Class, and then to review the output raster file in comparison to original raster image to determine the accuracy of the classification.
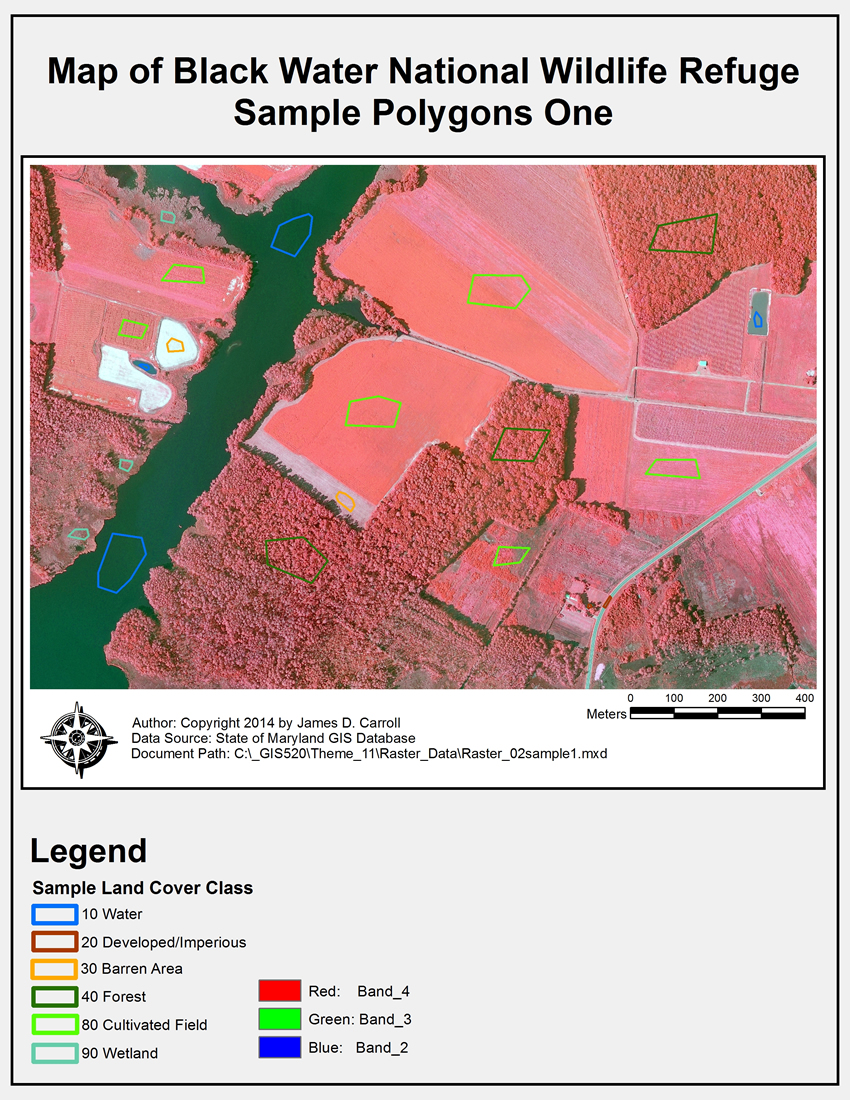
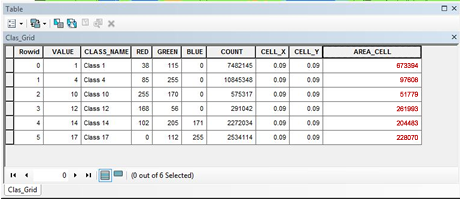
The Sample Polygons will be saved as a shapefile for further use, and a new GRID file will be exported from the raster output file. The area for each Land Cover Class will be calculated and recorded.
6. The Third Analysis Step will be to perform a second Supervised Classification using additional training sample polygons to produce a more accurate classification. The output raster file will be compared to the first output raster file and original raster image for accuracy.

The Sample Polygons will be saved as a shapefile for further use, and a GRID file will be exported from the raster output file. The area for each Land Cover Class will be calculated and recorded.

7. The results between the different Supervised Classifications will be compared for differences and accuracy.
8. Create a presentation map for each result and save the map file.
Discussion
I found most complex aspect for this exercise was trying to understand how to make training sample polygons to produce the most accurate classification results. There were inaccuracies in all the Land Cover Classes, but especially where there were interconnections or shadows. When I did the second supervised classification I attempted to compensate for this, and the result was not totally unsuspected. The dark colors became pervasive, so I decided to perform a third supervised classification to see what the results would be. I actually used a combination of small and large polygons to see what the results would be. The third process produced a much more accurate classification result, but the Water Class 10 area moved into some shadow areas, some Wetland Class 90 area was lost too, and the Forest Class 40 area overlapped into more Forest Class 40 area.
Evaluation
I think this type fo classification process requires much experience to understand how to use sample polygons with the correct sizes, locations, and accuracy to obtain the best classification results. This is not a one step process, but can require multiple attempts, even starting over multiple times if necessary.
This geoprocess is very useful for the government planning and decision-making relating to environmental issues. Good and accurate data is required for final decisions on land use and management, and this type of analysis will provide a high level of confidence that the data being used and presented is accurate. I believe additional GIS analysis and geoprocessing needs to be performed and combined with the classification process to varify the results and provide a more complete report.