Data Cardinality
The Problem
This exercise introduced the capabilities of ArcGIS for creating relationships (cardinality) between tables through the process of joining and relating tabular and spatial data (geometry). The Smart Data Compression (sdc) file format is also introduced. The emphasis is on the use of the Join toolset and Spatial Join tool.
The project mission is to provide a professional GIS analysis, report, and maps for each State Senator and House Member for the State of North Carolina which will show the exact number of created jobs (N.C only) in their district based on the N.C Industrial Extension Jobs Survey. The report and maps shall show the data for neighboring districts for comparison of each district’s performance.
Strategies
This GIS analysis will be performed using ArcGIS 10.2.2 ArcMap and ArcCatalog to process the N.C. Industrial Extension Jobs Survey table, the NC Senate Districts and House Districts shapefiles, and NC Zip Code smart data compression file, all of which contain the necessary related data, including database tables. The data sources for these files were the State of North Carolina and the NC State University GIS Library. This project will require the analysis of the variable which is of highest interest, EMPLOY_SUM, and the data for the N.C ZIP Code, NC House Districts, and NC Senate Districts.
Methods
Part One:
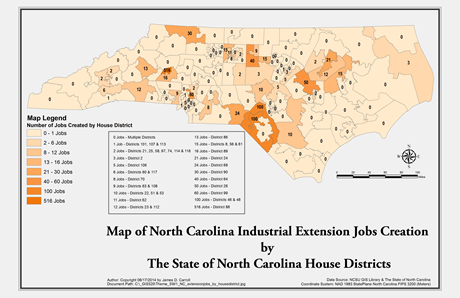
The tables and geometry will be geoprocessed to make new databases and shapefiles with the correct information through the use of select by attributes, expressions, joins, summarizing, and spatial joins. The objective is to make both a final House and Senate shapefile with attribure table which combines the correct EMPLOY_SUM and house districts and senate districts data. These will then be developed into maps of the State of North Carolina for both the House and Senate Districts which will show the job total creation for each district.
1.
Save a blank ArcMAP map file to "My_Name".mxd.
2. The symbology
for any layers and features should be edited for ease of use at any time doing the process.
3.
Add the "NC_Job_creation_Survey_Results.xls" file, the Smart Data Compression ZIP Code (sdc) points file, and NC House District shapefile to the Data Frame.
4. Verify and configure the State Plan Coordinate system.
5. Open the table for "NC_Job_creation_Survey_Results.xls" and Select by Attributes the Select by All and export the selected data into a new "NC_Jobs" database (dbf) file, and add to the Data Frame.
6.
Open the table for the "zip_usa.sdc" ZIP Code file and Select by Attributes "STATE" = 'NC' and export the selected Features into a new "ZIP_Points_House" shapefile, and add to the Data Frame.
7.
Summarize the new "NC_Jobs" database table by the ZIPCODE field, then summarize the new file table using the EMPOY_SUM field to produce a new "NC_Jobs_Sum" database file. Perform the same process for the new "ZIP_Points_House" layer table.
8. Join the
"NC_Jobs_Sum" database layer and "ZIP_Points_House" layer to create a new "ZIP_Points_NC_House" shapefile and add to Data Frame. Open the layer table and Select by Attributes "NC_Jobs_sum_sum_Employ" expression and export the selected features to a new "ZIP_Points_NC_House_01" shapefile.
9. Select the "NC House District" layer and spatially Join with the new "ZIP_Points_NC_House_01" layer to produce the final "NC_House_ Districts Jobs" shapefile which contains the number of jobs per district data.

10. Create a presentation map by configuring the Symbology to show the jobs per NC House District. Save the new map file.
Part Two:
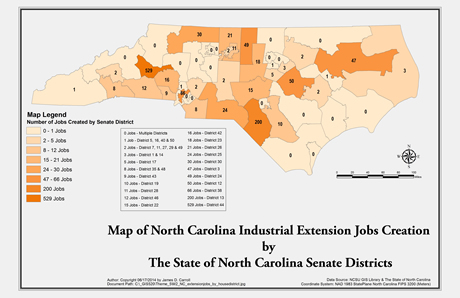
1. Repeat the process above for the "NC_Senate_District" shapefile using the new "NC_Jobs_Sum" database file to create the final "NC_Senate_ Districts" shapefile which contains the number of jobs per district data.
2. Create a presentation map by configuring the Symbology to show the jobs per NC Senate District. Save the new map file.
Discussion
The key to obtaining the final file was to correctly use the Join Tool to spatially combine the Point and Polygon data instead of using a normal Spatial Join. There were a couple of double records in the House District table which were an issue, but later I figured out how to combine them. One issue of ArcMAP, which is a continuous limitation for map production, is how to produce enough ramped colors, or other color ranges, in ArcGIS to represent larger numbers of legend data in a more readable format. I tested many different combinations, even charts, for the final map design.
Evaluation
Again, I will be able to use the skills and processes learned in this assignment to develop the analysis process and strategies to create static and on-line maps for future projects. It is critical for GIS analysis to be able to understand and work efficiently with tabular and spatial data such as ZIP codes and related geometry. I have proposed creating an overall map of North Carolina which contains all site locations for historic and present modern architecture listed by architect, location, city, etc. It would be interesting to compare different cities, areas of cities, zip codes, urban vs. rural, etc. to see the patterns of development of modern architecture in North Carolina. This State is #3 in the USA for the number of modernist design residences, and there are also many other types of building categories represented. Many have been demolished, so location maps and a database of existing and demolished sites would be very useful for educational and historic purposes.